Research
The 2026 business aviation crew management benchmark: 10 key findings
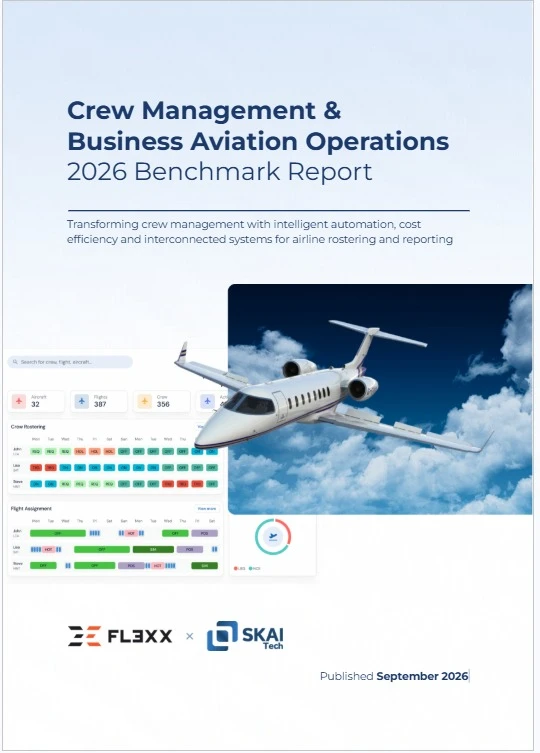
The FL3XX × SkAI Tech Crew Management Benchmark 2026 measures how business aviation operators actually roster their crews: crewing headcount, rostering models, freelance reliance, preference handling. Ten figures carry the whole finding: a centralised function, under-resourced, spending its time reacting rather than planning.
How was the benchmark built?
The Crew Management & Business Aviation Operations — 2026 Benchmark Report was published in August 2026 by FL3XX and SkAI Tech. It draws on the FL3XX × SkAI Tech Crew Management Benchmark Survey (2026), run with 30 business aviation operators flying from fewer than 5 to more than 30 aircraft. Respondents sit at decision level — CEOs, COOs, chief pilots, directors of flight operations and directors of charter — the people who set headcount and make the call when a flight is at risk of not departing.
Two scope notes worth carrying through everything below. The field is business aviation: these proportions do not transfer to regional, ACMI or medevac operations without checking. And every percentage here comes from that survey of 30 operators and is attributed as such; the deployment outcomes come from a different source — SkAI Tech deployments in 2025-2026 — and are flagged separately.
Context gives the finding its weight: the segment is growing. Per GAMA, 854 business jets were delivered worldwide in 2025, +11.8% on the 764 delivered in 2024, and 162 business jets were delivered in the first quarter of 2026, +14.9% year on year. Every delivered aircraft adds crew to roster. The bottleneck described below will not resolve itself.
1. 85% have a dedicated crewing team of one to three people
Per the FL3XX × SkAI Tech Crew Management Benchmark 2026, 85% of the 30 operators surveyed have a dedicated Ops/Crewing team, so rostering is a genuinely centralised function. But for fleets of up to 15 aircraft, that team is typically one to three people. Every rule, type rating and crew habit lives in two or three heads, with the continuity risk that implies the moment one of them is on leave.
2. 81% describe their crewing headcount as stretched
The FL3XX × SkAI Tech Crew Management Benchmark 2026 finds 81% of the 30 operators surveyed calling their crewing headcount stretched. Behind the word sits an observation rather than a judgement on the people: no capacity reserve exists to absorb a holiday, a resignation or a heavy week. A stretched team keeps producing rosters; it just has less time to check them.
3. 85% are not "very confident" in their rostering process
Still per the FL3XX × SkAI Tech Crew Management Benchmark 2026, only 15% of the 30 operators surveyed describe themselves as "very confident" in their rostering process, leaving 85% who do not. Read it as a coverage indicator rather than a satisfaction score: no single missing feature explains a number like that. The process as a whole fails to reassure the people running it.
4. 88% spend significant time firefighting
Close to nine in ten operators — 88% of the 30 surveyed in the FL3XX × SkAI Tech Crew Management Benchmark 2026 — spend significant time reacting to the unplanned rather than planning. The breakdown matters: 65% describe their energy as balanced between planning and reaction, while 23% are in pure firefighting mode. One operator in four, in other words, spends most of its time repairing.
5. 77% combine several rostering models
The survey's most structurally important result. Across the 30 operators surveyed, the FL3XX × SkAI Tech Crew Management Benchmark 2026 records 54% on fixed rotation patterns (7/7, 7/5…), 46% on dynamic pooling and 38% with crew permanently dedicated to one aircraft, with 77% running more than one of these at the same time. The models stack rather than compete, and it is their coexistence that makes the trade-off hard.
6. 58% are multi-base, 31% run home-based crews
Per the FL3XX × SkAI Tech Crew Management Benchmark 2026, of the 30 operators surveyed 31% work from a single fixed base, 58% are multi-base and 31% have fully distributed, home-based crews. The consequence is immediate: the question is no longer only who flies, but where they start from and how they reach the aircraft. Hence recurring positioning, which consumes duty time without ever showing up as a rostering cost.
7. Human factors are the leading driver of unplanned change (77%)
Fatigue, sickness, unavailability: human factors top the causes of unplanned change, cited by 77% of the 30 operators surveyed in the FL3XX × SkAI Tech Crew Management Benchmark 2026. This is the figure that connects roster fairness to operational performance: a roster that always loads the same crew manufactures a share of the disruption it will then have to absorb.
8. Three in four use freelance crew, and one in two calls it a band-aid
Across the 30 operators surveyed, the FL3XX × SkAI Tech Crew Management Benchmark 2026 finds three in four using freelance or contract crew, and one in two describing that reliance as a band-aid rather than a strategy. In detail, 35% use it as an operational bridge while recruitment or training completes, and 31% out of necessity in the face of shortage or an unplanned departure. It is an expensive adjustment lever, and operators know it.
9. Half collect leave and preferences with no structured system
Roughly half of the 30 operators surveyed gather leave requests and crew preferences by phone, WhatsApp or email, with no structured system behind them (FL3XX × SkAI Tech Crew Management Benchmark 2026). The arbitration rule that follows is first-come-first-served: whoever messages first wins, because nothing else can be defended. An informal collection channel leaves no usable record — neither to balance the load across crew members, nor to explain the call to the person who did not get the dates they asked for.
10. 1.4 × 10²³ possible rosters from 14 flights and 10 crew
The report shows why manual planning hits its ceiling mathematically rather than through any lack of rigour: from a pool of just 14 flights and 10 crew members, 1.4 × 10²³ rosters are possible. A human planner evaluating 1,000 of them per second would need 321 times the age of the universe to see them all. No operator is searching for the optimal roster; they are searching for one that holds. That is precisely the problem.
What the report concludes
The benchmark does not stop at the diagnosis. It sets out five characteristics expected of a modern solution — a unified view of the problem, continuous feasibility evaluation, visibility on constraint margins, propagation awareness, and risk-based prioritisation — and documents outcomes observed across SkAI Tech deployments in 2025-2026, varying with fleet size and operating model: +21 points of direct flight coverage by releasing +0.42 duty days per pilot per month, up to −40% freelance duty days, −19% duty spread between crew members, +14% more days-off requests granted and −15% extra duty days.
One line from the report frames the stake better than any table: "The most expensive aircraft is the one sitting on the ground for lack of crew."
Where to read the report and benchmark yourself
The full report is available online, with all of its figures and interview quotes, in exchange for your details: read the 2026 Crew Management Benchmark. It comes with a Crew Ops Self-Assessment: 8 questions, about 3 minutes, and a personalised score placing your operation against the operators analysed in the benchmark. It is the fastest way to find out which of these ten findings you are already on the right side of.
FAQ
How many operators does the 2026 benchmark cover?
The survey was run with 30 operators: business aviation companies flying from fewer than 5 to more than 30 aircraft, surveyed at CEO, COO, chief pilot, director of flight operations and director of charter level. A sample of that size is enough to surface structural patterns in a concentrated segment; it does not support slicing the results into fine sub-segments, and the percentages quoted here should be read with that order of magnitude in mind.
Do these figures cover regional, ACMI or medevac operations?
No. The FL3XX × SkAI Tech Crew Management Benchmark 2026 surveyed business aviation exclusively. The mechanisms it describes appear in other segments too, but the proportions do not transfer without verification.
Are the deployment outcomes guaranteed?
No, and the report says so explicitly: these are results observed across SkAI Tech deployments in 2025-2026, varying with fleet size and operating model. They give an order of magnitude for what optimisation delivers on comparable operations, not a contractual commitment.
Does acting on these numbers mean replacing the ops system?
No. SkAI Tech connects as an API add-on to the operations system already in place: flights, crew and qualifications stay where they are, while optimisation and compliance checking sit on top. No system migration is required.
Sources
- Crew Management & Business Aviation Operations — 2026 Benchmark Report, FL3XX × SkAI Tech, August 2026: survey of 30 business aviation operators, interview quotes, combinatorial demonstration and five-characteristic framework.
- SkAI Tech deployment outcomes 2025-2026, quoted with the report's own caveat: results observed across those deployments, varying with fleet size and operating model.
- General Aviation Manufacturers Association (2026), First Quarter 2026 Aircraft Shipment and Billing Report, published 28 May 2026 and updated 1 June 2026 — gama.aero: 162 business jets delivered in Q1 2026 (+14.9% year on year) and 854 across 2025 (+11.8%).